"Data Driven Conservation in the Lac Télé-Lac Tumba Landscape"
Azavea Summer of Maps, 2017
Azavea Summer of Maps, 2017
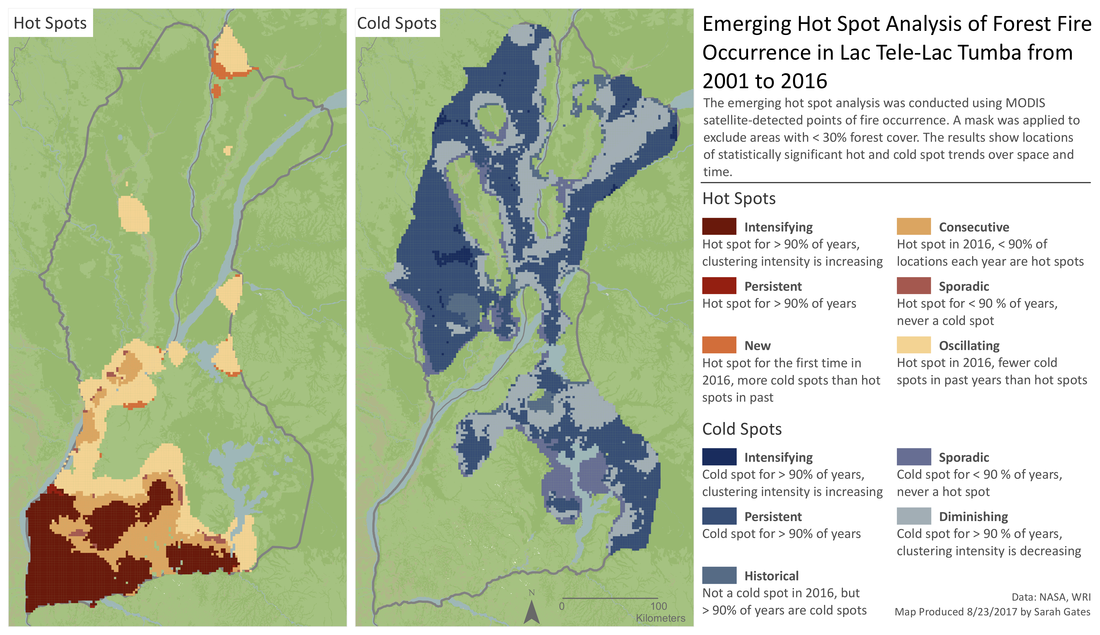
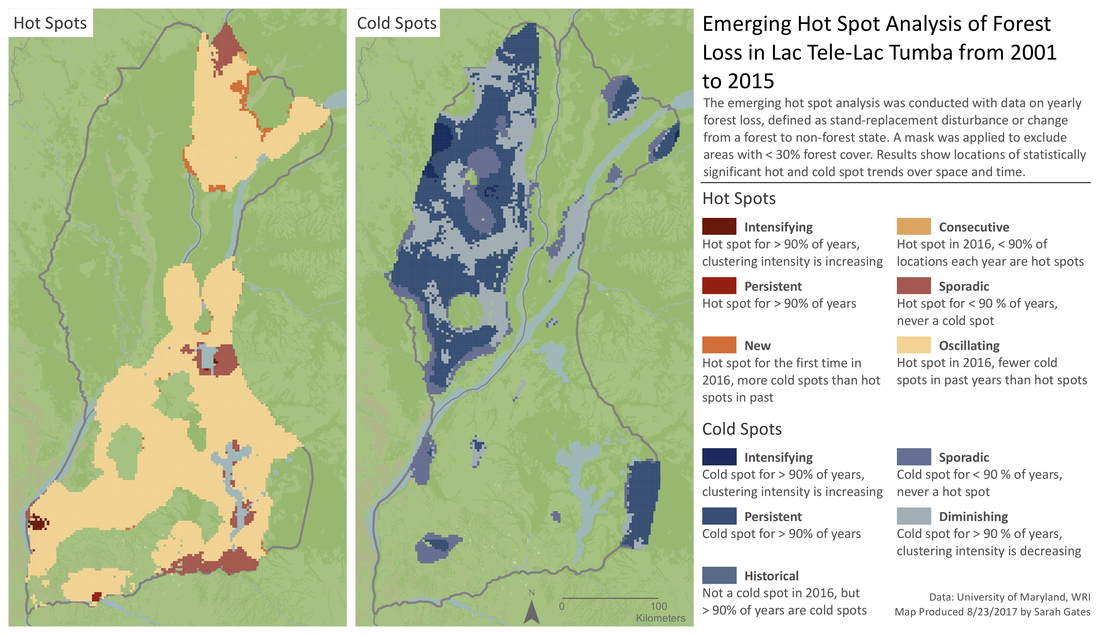
I worked with the World Resources Institute to assess the success of conservation efforts in the Lac Télé-Lac Tumba landscape, located in the Democratic Republic of the Congo and the Republic of the Congo. I analyzed data on forest fires and forest loss throughout the study area to understand patterns across space and time. This blog post details the Emerging Hot Spot Analysis method I used to analyze the data and create visual representations of the change in forest fire and forest loss occurrence over time.
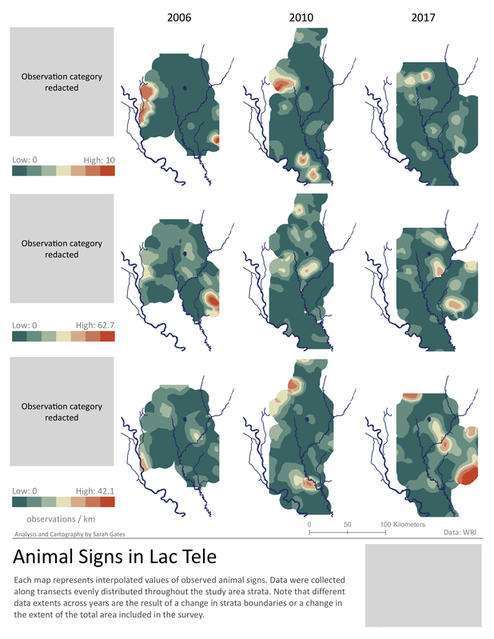
I also analyzed data on animal and human observations collected along transects as part of a wildlife survey in a region of the Lac Télé-Lac Tumba landscape. I used R and ArcGIS to clean and process the data, and wrote a Python script to automate the creation of ninety interpolated maps. The maps reveal patterns of observations of animal signs, for example elephant paths or gorilla nests, and human signs, for example weapons or forestry transects, and how the patterns change over time. The document shown to the right has the inset map and observation category redacted to protect sensitive information.
"Petrochemical Pollution in the San Francisco Bay Area"
Azavea Summer of Maps, 2017
Azavea Summer of Maps, 2017
I worked with the Fair Tech Collective, a non-profit organization based at Drexel University, to investigate the impact of air pollution from five major petrochemical refineries in the San Francisco Bay Area using data on refinery flaring activity and air toxin concentrations measured by fenceline monitors as part of their "Meaning from Monitoring" project. I used R extensively for data wrangling, analysis, and visualization. I investigated the presence of sensitive receptors living near the five refineries and combined my findings with analyses of flaring and fenceline monitoring data to produce a series of infographics.
"An Assessment of Forest Fire Risk in Kalimantan, Indonesia"
Clark University, GIS for International Development in Practice, 2017
Clark University, GIS for International Development in Practice, 2017
I conducted a comprehensive assessment of forest fire risk in Kalimantan, Indonesia, also known as Indonesian Borneo, using a combination of environmental and human factors. I performed a Weighted Sum analysis in ArcGIS using six variables; land cover, distance to settlement, precipitation, distance to roads, Compound Topographic Index (CTI), and elevation to determine areas of low and high forest fire risk. A raster data layer was computed for each variable and reclassified to a scale of 0 -10, ranging from least fire risk to most. Each variable was assigned a certain weight based on its influence on fire occurrence, determined from a literature review of similar risk assessments from the same geographic region. The Weighted Sum was calculated by overlaying the raster layers, multiplying each layer by its assigned weight, and summing them together. The result is a raster layer with a range of low values, indicating low fire risk, to high values, indicating high fire risk. Finally, to assess the accuracy of my model, I compared the forest fire risk map with satellite-detected points of fire occurrance from 2015 and 2016.
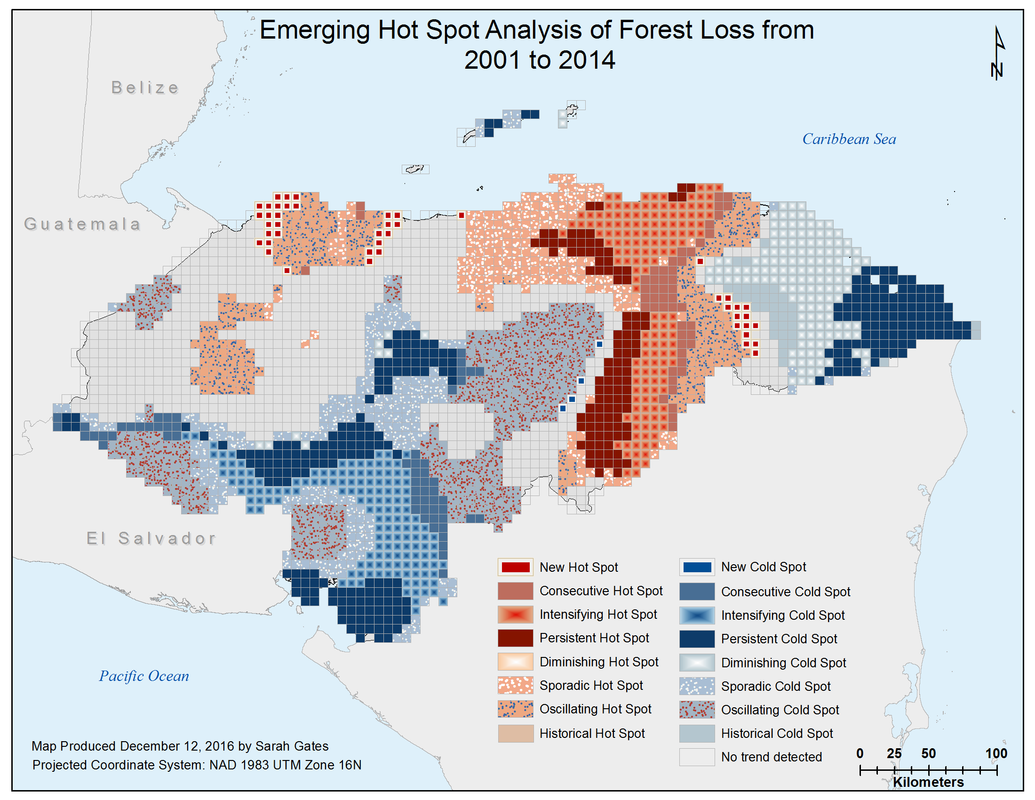
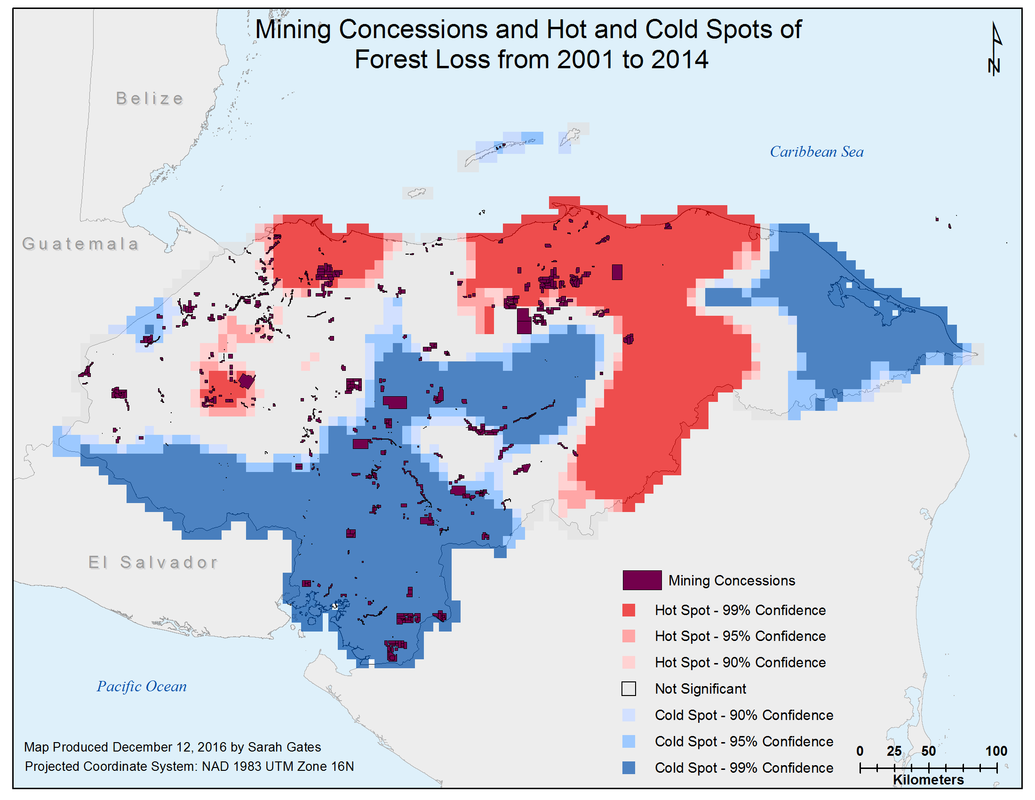
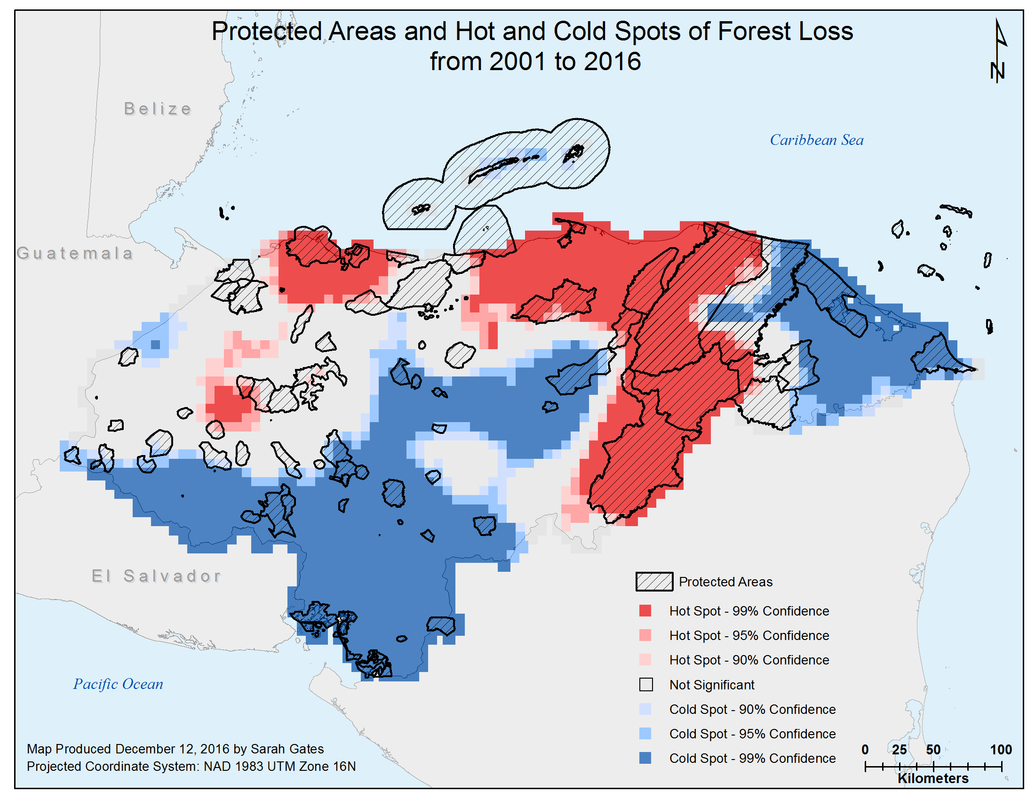
"Characterizing Forest Loss in Honduras: an examination of the spatial relationship between forest loss, mining concessions, and protected areas"
Clark University, Advanced Vector GIS, 2016
Ali Filipovic and myself studied patterns of forest loss in Honduras and conducted spatial analyses on the relationships between forest loss, mining concessions and protected areas. I converted a raster data layer of forest loss occurrence in Honduras from 2001 to 2014 to a point shapefile, added a date field, and then created a Space Time Cube. The Space Time Cube was then used to conduct an Emerging Hot Spot analysis that identifies clusters in point densities and determines the behavior of these clusters over time. The results reveal areas within Honduras that are hot and cold spots of forest loss and describe whether these hot and cold spots are increasing or decreasing in intensity over time. Mining concessions and protected areas were also overlaid with the hot spot analysis.
"Visualizing Voter Turnout in the United States using Python"
Clark University, Computer Programming for GIS, 2016
Clark University, Computer Programming for GIS, 2016
I collaborated with Lucy Lee and Eric Keller to write a Python script for the creation of dynamic maps to visualize voter turnout in the United States from 1980 to present day. This project required the use of the ArcPy module as well as the modules OpenPyXL and images2gif, both of which were self-taught. The final Python script read data from a Microsoft Excel workbook and used that data to create shapefiles containing information about voter turnout rates. ArcPy was utilized to automate creation and exporting of maps in ArcGIS and then images2gif was used to create GIF animations of the voter turnout maps.

Voter Turnout for Presidential Elections.
|
Voter Turnout for Midterm Elections.
|
Voter Turnout for all Federal Elections.
|
2015 Center City Parking Inventory
As an Intern for the Philadelphia City Planning Commission I was an author on the 2015 Center City Parking Inventory report. The report details the results of a study that I organized on public parking facilities in Center City Philadelphia. I collected data on occupancy rates, cost of parking, and whether new development had taken place on previous parking lots and then analyzed this data to determine trends across Center City. I created several maps, included in the report, to detail the parking facility locations and occupancy and cost patterns in Center City neighborhoods. My research and analysis led me to draw conclusions about the supply and demand for parking in Philadelphia, as well as to develop recommendations for reducing air pollution, increasing sustainability, and improving the overall parking experience.
